
Free Material
Hear what people say about Targeted Training and SATCo…………
The Paediatric Orthopaedic Surgeon’s view on Targeted Training
The physiotherapist’s thoughts about Targeted Training
Penny Butler of Optimi talks about the unique features of Targeted Training
‘Videos with kind consent of Dr Mindy Silva of the Wired Collective’
FREE MATERIAL
To access any of our free material you will need to register with us.
SATCo
SATCo is a unique method of assessing head and trunk control
Access your free-to-view SATCo resource here
‘How to’ videos, interviews, Q&A
GMFM Percentile Calculator
This free XL calculator allows you to plot GMFM percentiles for up to 10 assessments.
Get your download here
HOW GROWTH CAN AFFECT A CHILD’S MOVEMENT ABILITIES AND FUNCTION
To view a discussion about this use the link to the GMFM calculator and scroll down the page
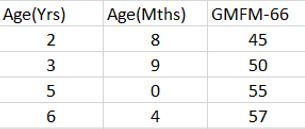
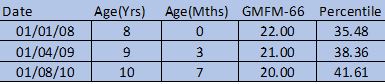
Here we see the same tabulated data with the percentile calculated and plotted on the right hand side.
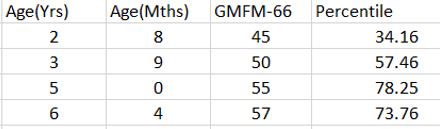
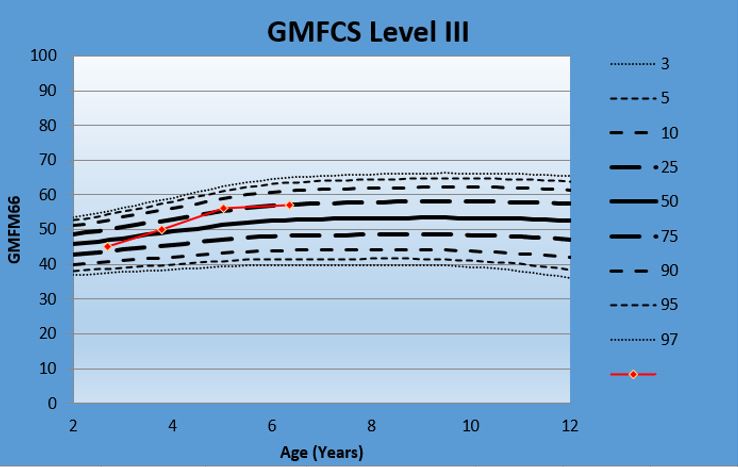
If you look at the final GMFM score, it continues the steady increase seen previously. Adding the percentile data shows how this child is faring in comparison with children of similar age and degree of disability. This data shows a plateauing where the child is not maintaining the same rate of change from measurement point 3 to 4 as in the previous measurements. This does not negate the improvement made by this child but is a reminder of the value of the percentile scores.
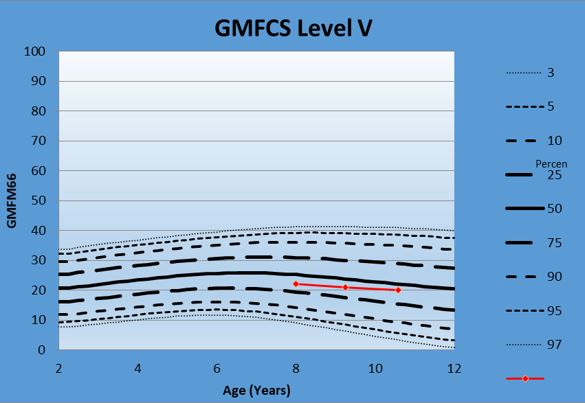
Revealing the percentile results shows that their peers would be losing performance at a faster rate so this child is really doing well.
Now read on if you would like the app to help you produce your own similar results.
N.B. The app contains macros and your protection software will probably issue a warning about possible viruses. We have checked the coding with a virus checker but you should only proceed if you trust us.
Excel will probably warn you that you need to enable macros by clicking on the yellow warning message.
Starting
When the App loads the opening screen appears.
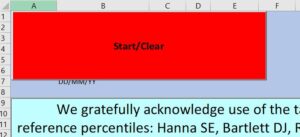
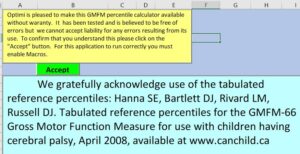
If you are content with the words in the yellow box click on the green “Accept” button causing this new red button to appear:
The APP can be started by clicking on this button which ensures that all previous data is cleared.
The calculator needs to know the child’s date of birth and the GFMCS classification of the child and these are set up as shown below:
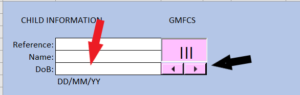 Entries should only be made in white boxes (any other entries will have unpredictable results). The child’s date of birth (DoB) should be entered into the box that the red arrow points to (The two boxes above may be left empty or you can use you own reference and name entries as you prefer). Note that DoB must be in DD/MM/YY format and the child’s age must be between 2 and 12 years.
The appropriate GMFCS classification can be selected by using the 2 left and right buttons identified with the black arrow. The graph on the RH side will change as you click on these buttons which can be rather fun.
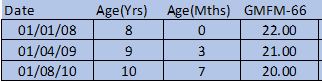
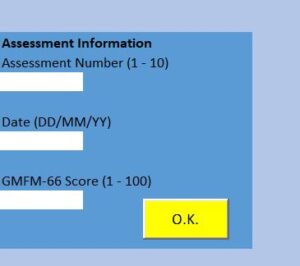 Now data from up to 10 assessments can be entered (please enter then in ascending date order:
For each assessment give the Assessment number 1, 2, 3, etc followed by the date (again in DD/MM/YY format) and then enter the GMFM-66 score in the lower box. Once all boxes are correctly filled out you may click on the yellow O.K. button. This causes the age and percentile value to be calculated and this information is displayed in the middle table and plotted on the graph. As you add more assessment information the table and chart will develop.
Clicking the grey ‘RESET’ button clears all data and returns to the opening screen condition.
At any stage you can see the resulting graph by selecting the ‘REPORT’ tab at the bottom of the screen and this screen may be printed if a hard copy is required.
To help you comply with local data protection legislation we suggest that the app is never saved when it has been used with data. Simply close the app using the red X at the top right.